
Procedure
The figure below shows how the various test elements should be interconnected.
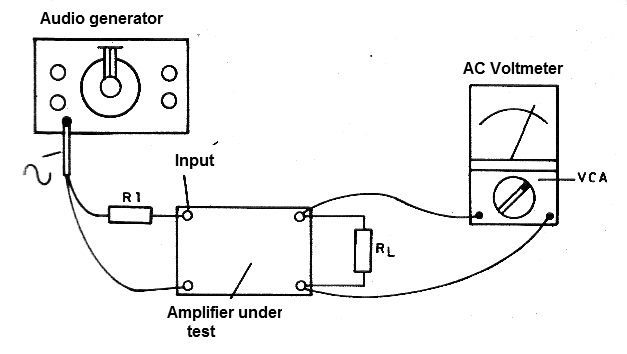
We initially set the audio generator to a minimum frequency below the audible limit, around 10 or 15 Hz. The signal produced must be sinusoidal.
Then we open the generator level and the volume to have a minimum reading on the scale, the instrument needle begins to move. From there, we increase the frequency of the generator in controlled steps and we will write down the values found in the graph.
The frequencies chosen may be, for example, 20 Hz, 50 Hz, 100 Hz, 200 Hz, 500 Hz, 1 kHz, 2 kHz, 5 kHz, 15 kHz and 20 kHz.
The graph obtained will be similar to the one obtained in the figure below. If there is saturation in the center frequencies of the range, reduce the signal strength and start the tests again from the beginning.


